Reactive Plants
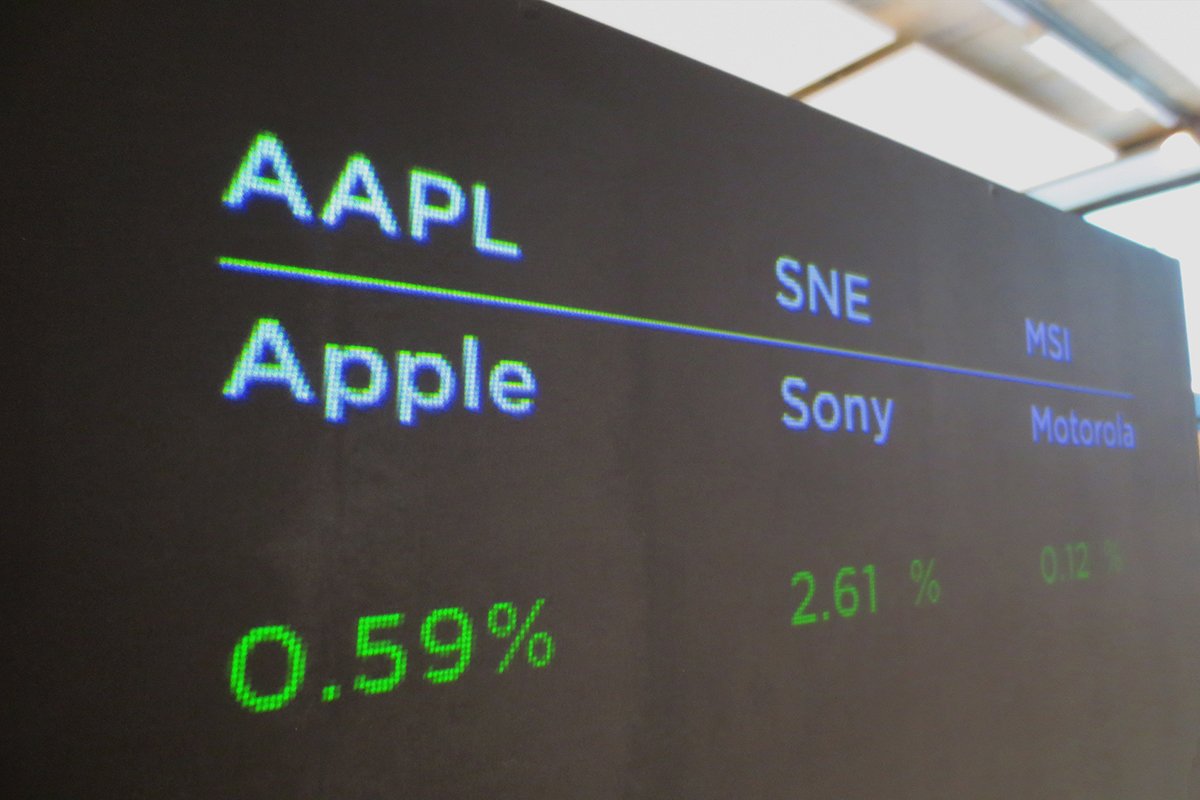
In this self-initiated project, I wanted to explore alternative ways to visualize complex information while making it enjoyable and easy to comprehend for everybody regardless of their age or knowledge about it. The topic I chose to carry out this experiment was the stock market, as it can be a very complex and even intimidating subject for some of us.
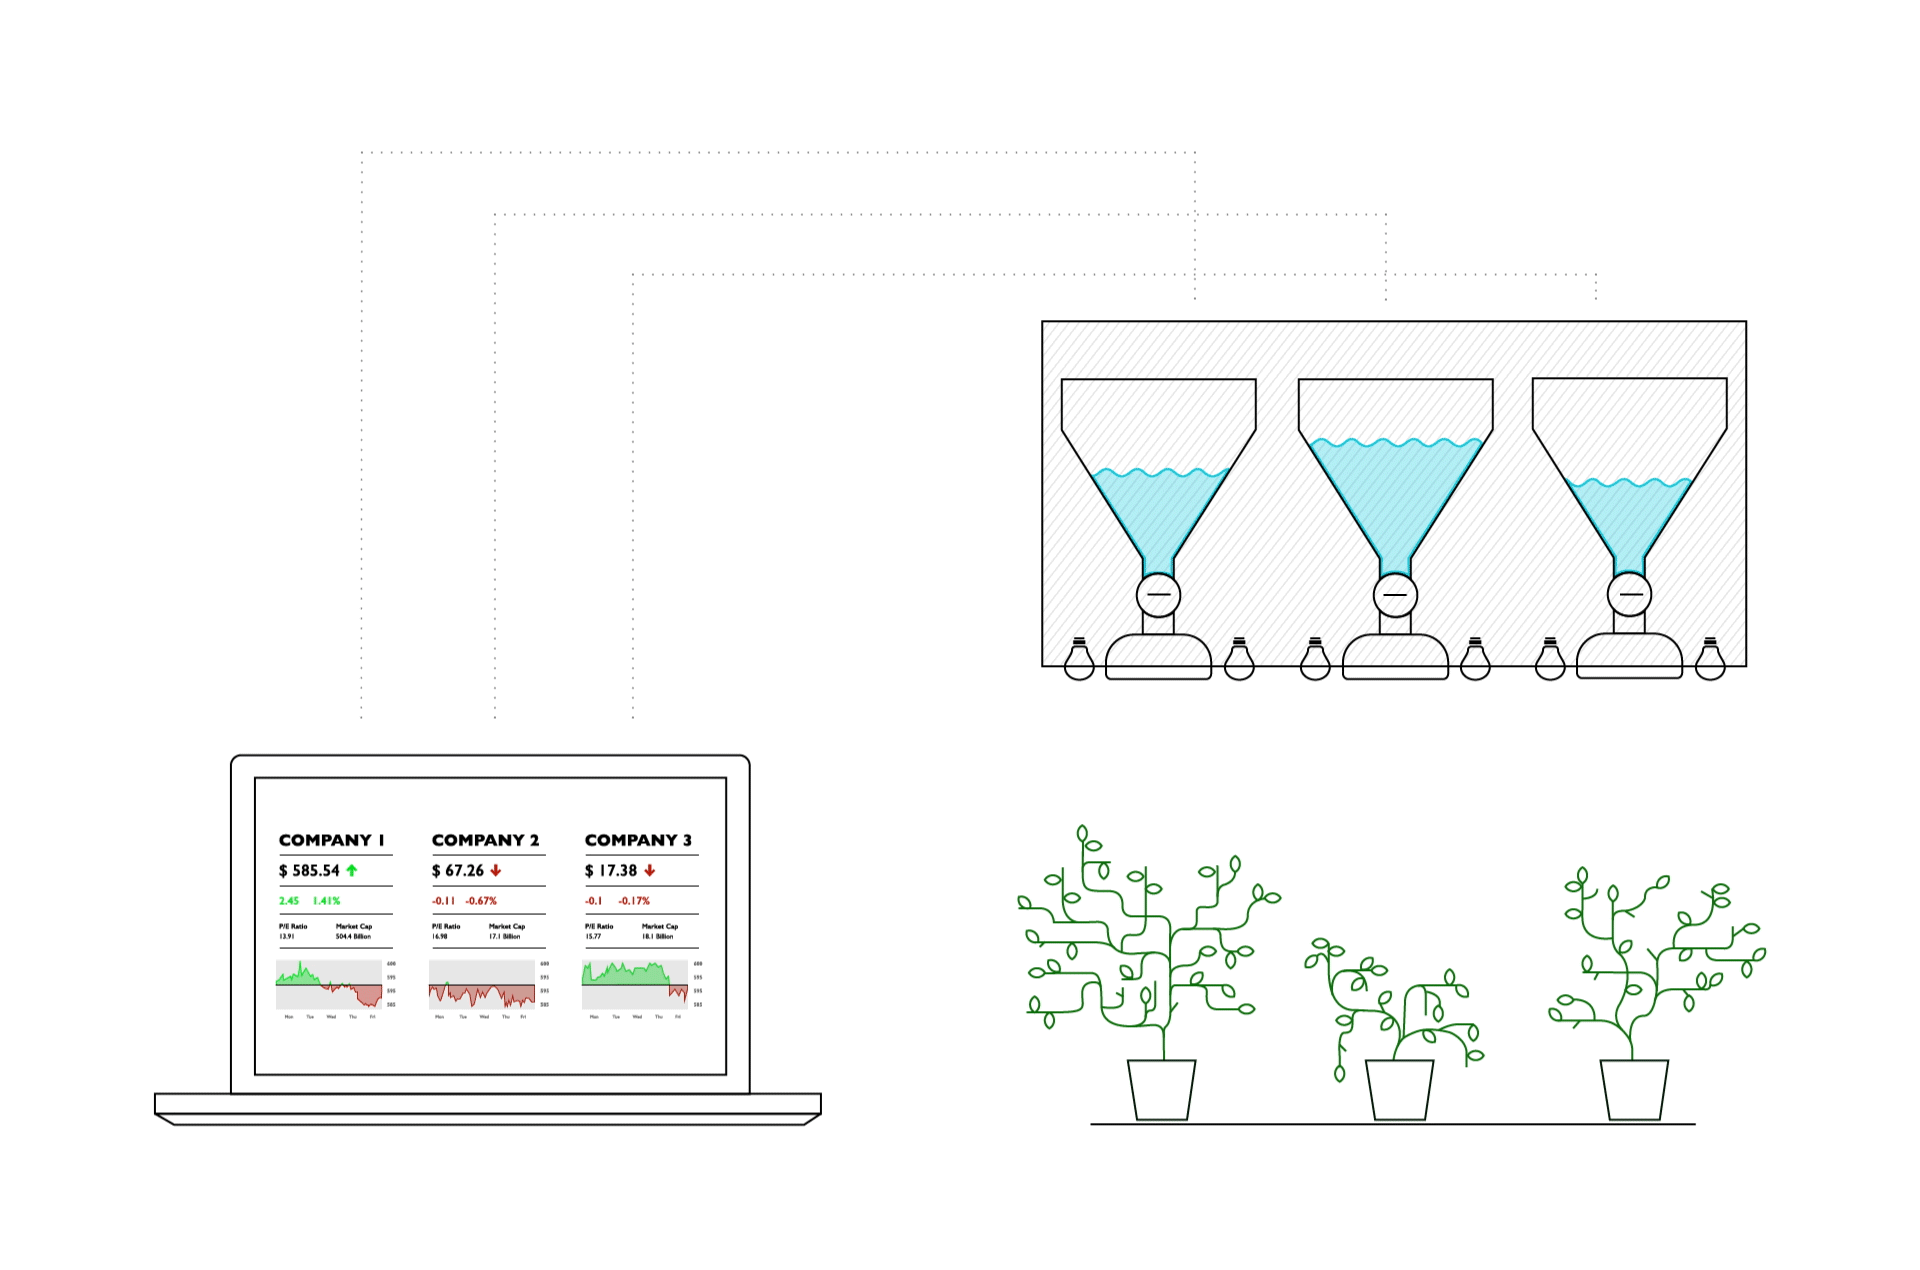
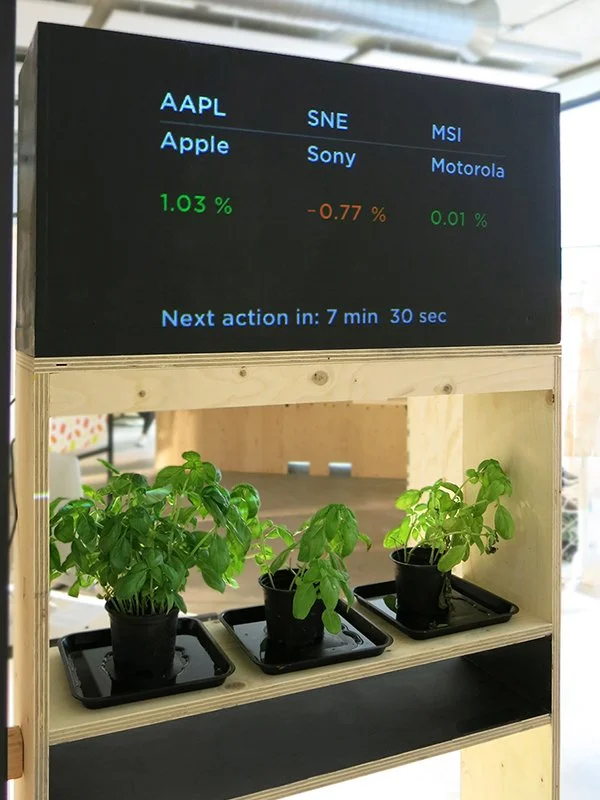
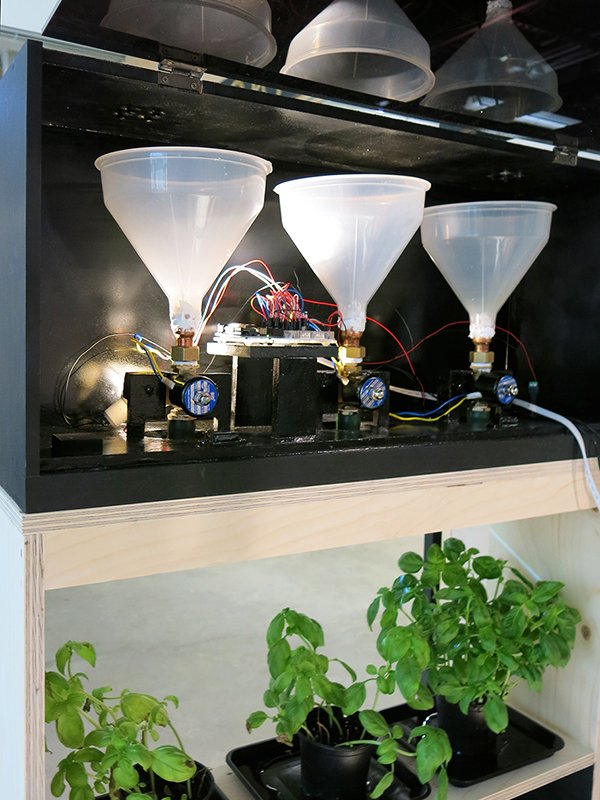
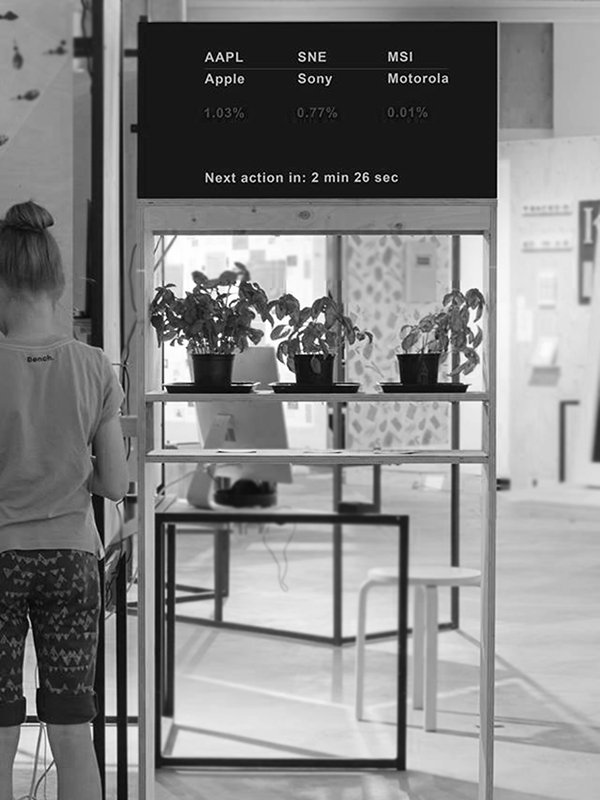
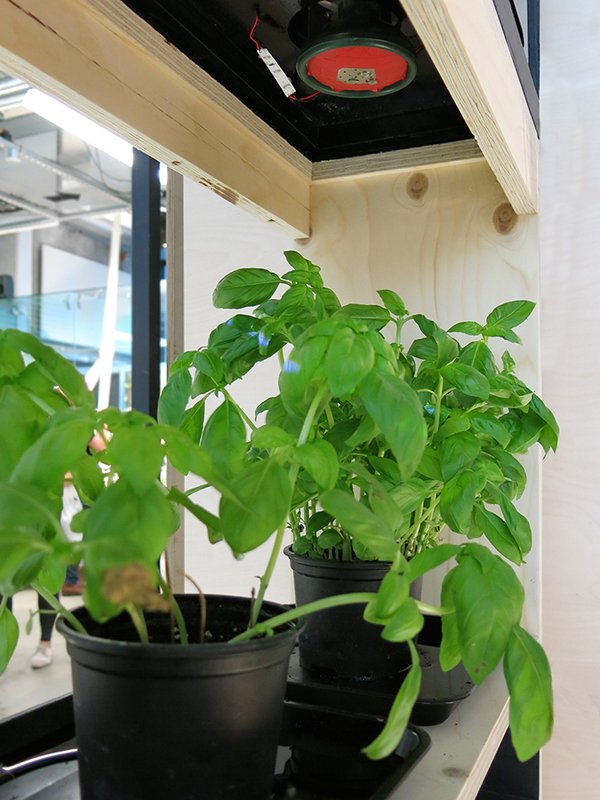
I created an installation in which basil plants show the ‘economic health’ of three companies: Apple, Nokia, and Motorola. Each plant receives live values from the stock market via the black box above it. As a result, the plants receive a proportional amount of water and light according to how the company did on the market over the past 24 hours.
Plants get water and light according to the real-time values of the stock market. As a result, the plants show the ‘economic health’ of the three companies. Visualizing complex data through things that we can relate to makes it easier not only to comprehend but also to remember complex and abstract information.
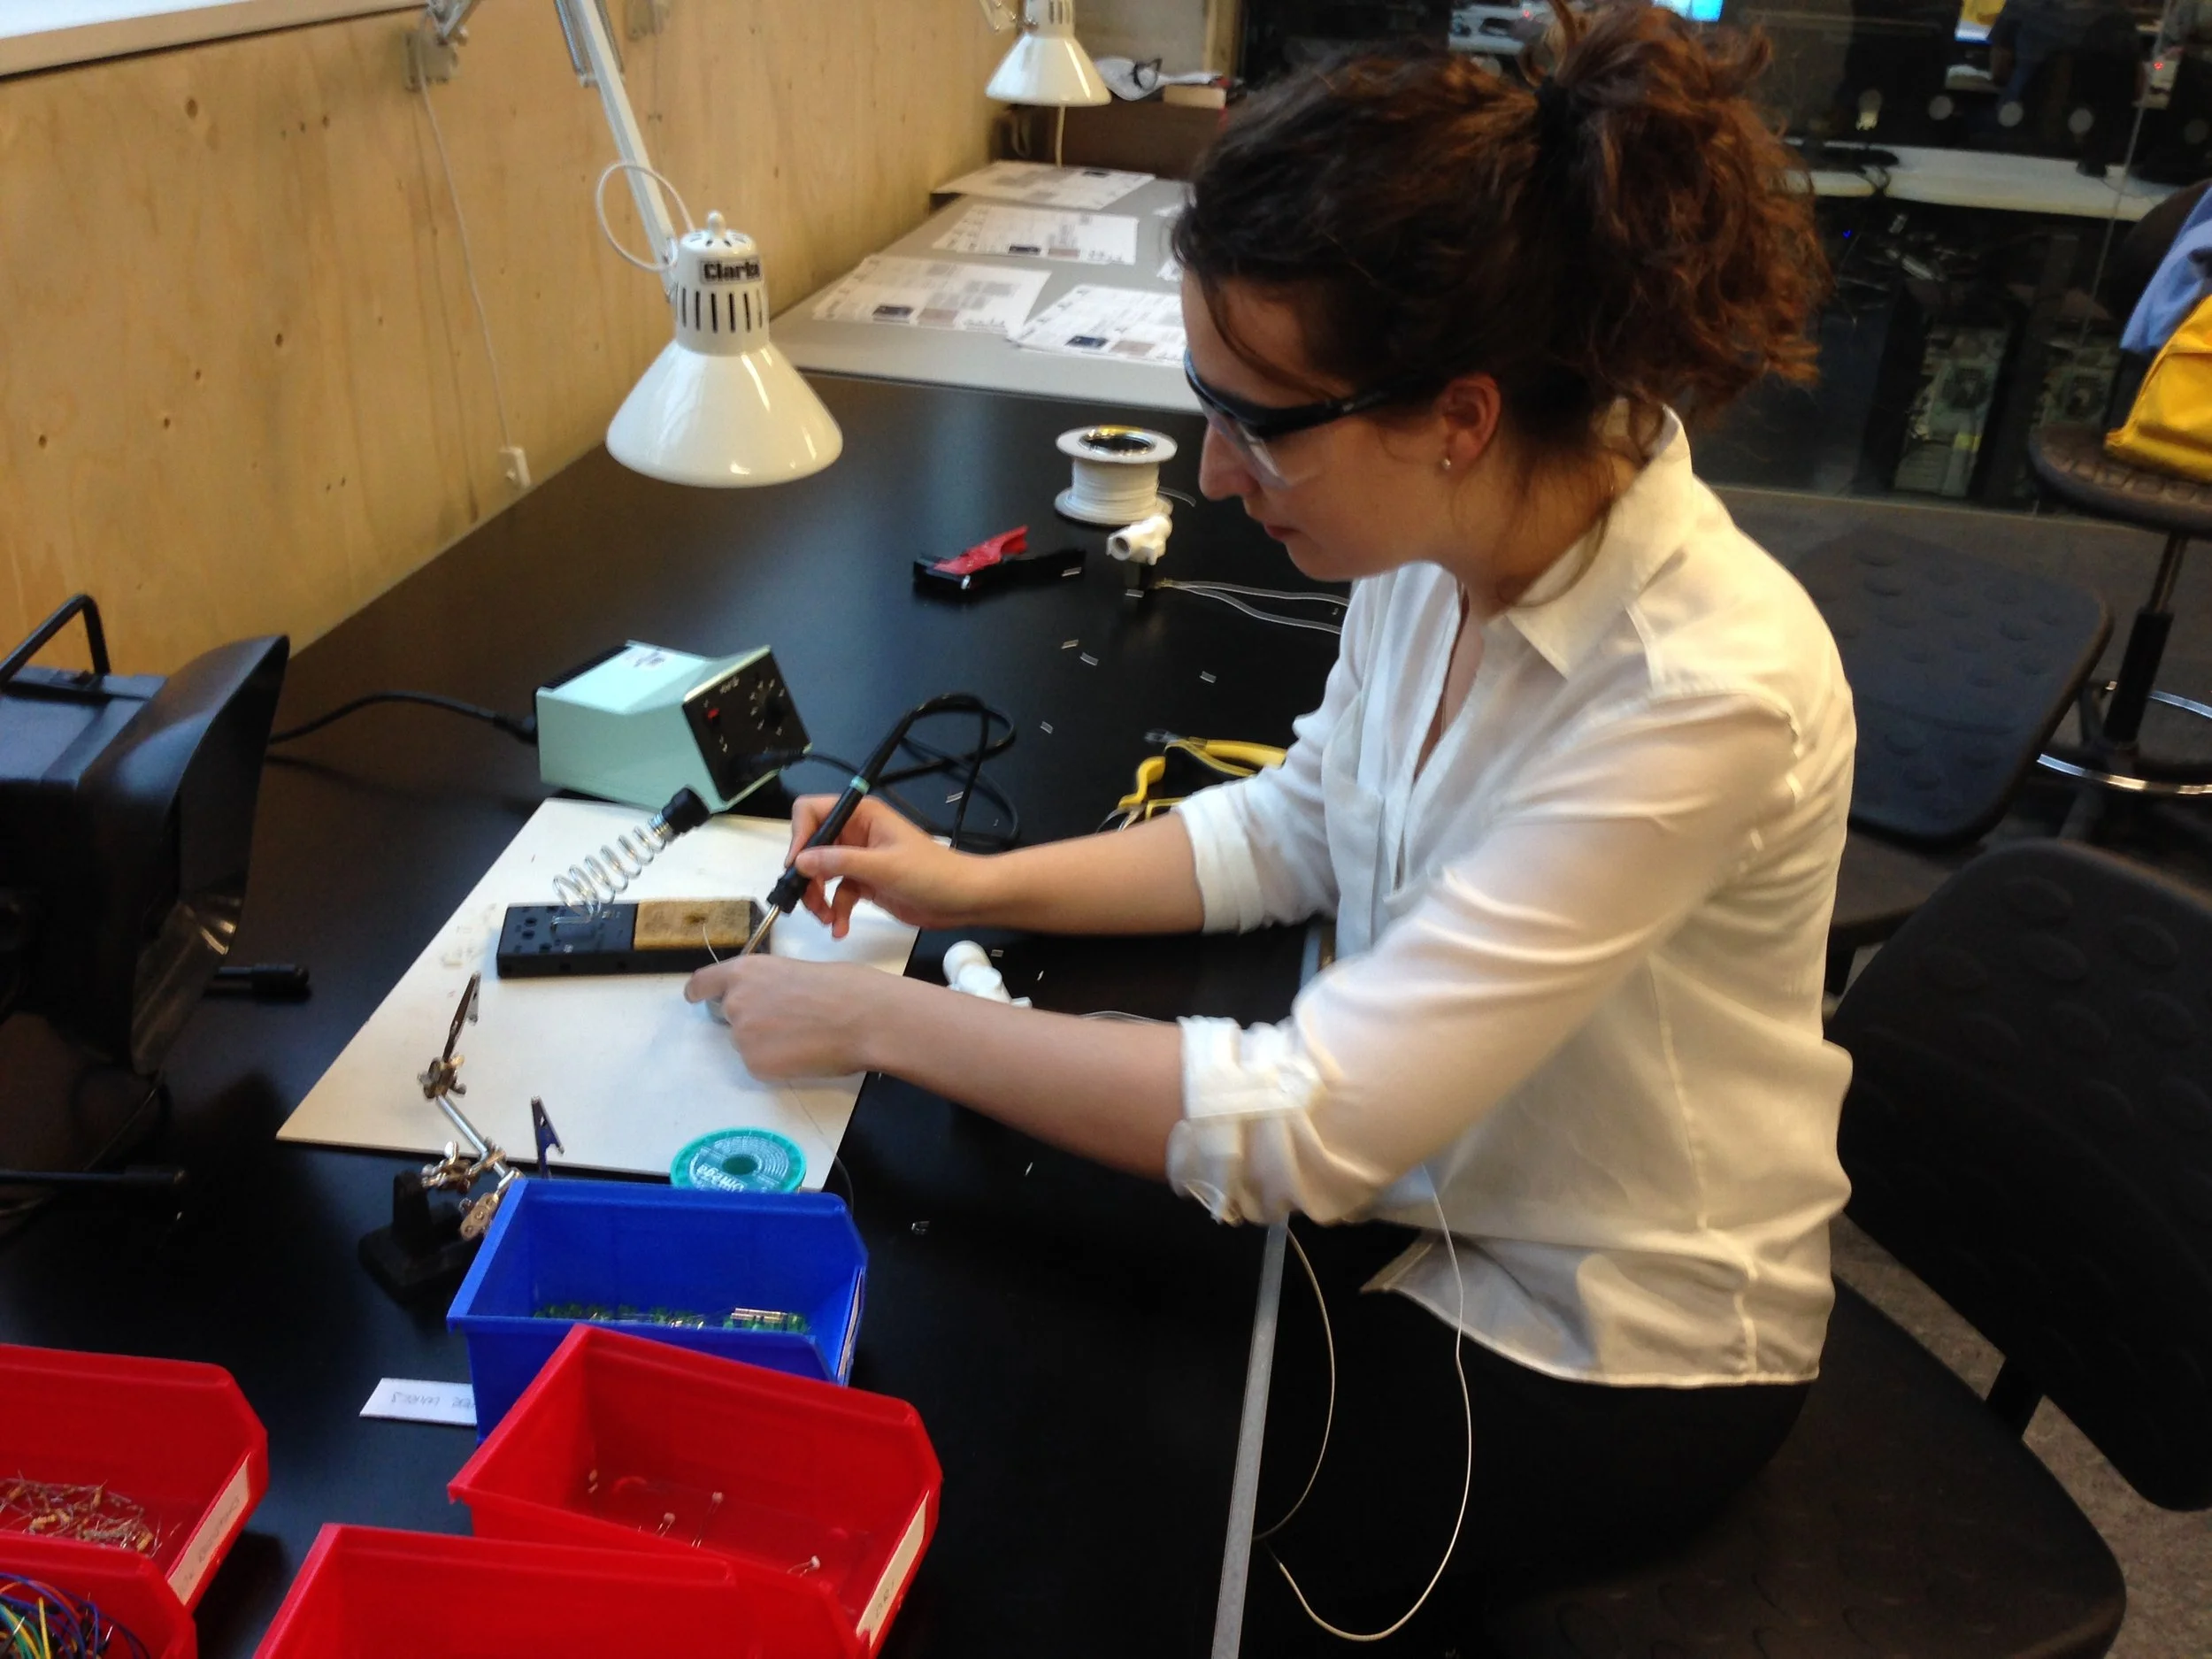
INFORMATION DESIGN /PROGRAMMING /
PHYSICAL COMPUTING